"Abstract: with the increasing development of digital technology, digital signal processing technology applied in the field of astronomical observation is becoming more and more mature. In this paper, the influence of ADC quantization on neutral hydrogen (HI) observation is studied and analyzed. Firstly, the hi observation is described; On this basis, the signal receiving and processing system for hi observation using laboratory 4.5 m antenna is described; The relevant formulas of ADC quantization and radio telescope sensitivity are mainly deduced, and compared with the data processing results of the actual observation of 4.5 m antenna. It is pointed out and confirmed that the impact of insufficient ADC quantization bits on the observation effect can be compensated by improving the integration time.
0 Introduction
At this stage, radio telescopes for astronomical observation are erected in many places. The erection site usually goes through a lot of site selection comparison, and finally a relatively suitable site is selected. Considering the convenience of use, some antennas built for testing will be built near urban workplaces. At this time, some communication signals in the city become strong radio interference signals, which has a great impact on astronomical observers.
In this paper, the 4.5m antenna is erected in the city. The purpose of discussion and analysis is to provide some reference for the observer who will observe the neutral hydrogen spectrum in the presence of strong radio interference, and point out and confirm that the influence of insufficient quantized bits of ADC on sensitivity can be compensated by increasing the integration time.
1 Introduction to neutral hydrogen (HI) observation
In 1944, Dutch astronomer Vande hulst proposed the prediction that the hyperfine structure transition spectral line of the ground state of Galaxy hydrogen (corresponding to the 21 cm spectral line of hydrogen) in the Milky way can be observed. The observation of neutral hydrogen began with Ewen and Purcell's observation of neutral hydrogen spectral lines in the Milky way in the 1950s. After that, a large number of neutral hydrogen observations were carried out [1].
It is very difficult to study interstellar regions by optical means, but the hydrogen atoms in these regions can radiate 21 cm spectral lines and will not be absorbed by those interstellar materials. Therefore, 21 cm spectral lines have become a powerful weapon for exploring space. The distribution and motion of neutral hydrogen in the Milky way can be understood in detail through observation, which lays a foundation for accurately measuring the distance of some celestial bodies. High resolution neutral hydrogen observation is also an important means to study Galaxy interaction.
The magnetic moment produced by the electron spin of the neutral hydrogen atom in the ground state has two possible orientations relative to the nuclear magnetic moment produced by the hydrogen nuclear spin: parallel or antiparallel. The energy of the former is higher than that of the latter. When the neutral hydrogen atom in the upper level transitions to the lower level, it emits photons with a frequency of 1420.406 MHz and produces 21 cm hydrogen spectral line radiation. In the absence of external disturbance, its spontaneous transition probability is very low. A neutral hydrogen atom at the high energy level of the ground state has only one chance to transition to the low energy state in about 11 million years, resulting in a small natural width of the 21 cm spectral line [2].
2. Signal receiving process of neutral hydrogen observation and introduction of observation equipment
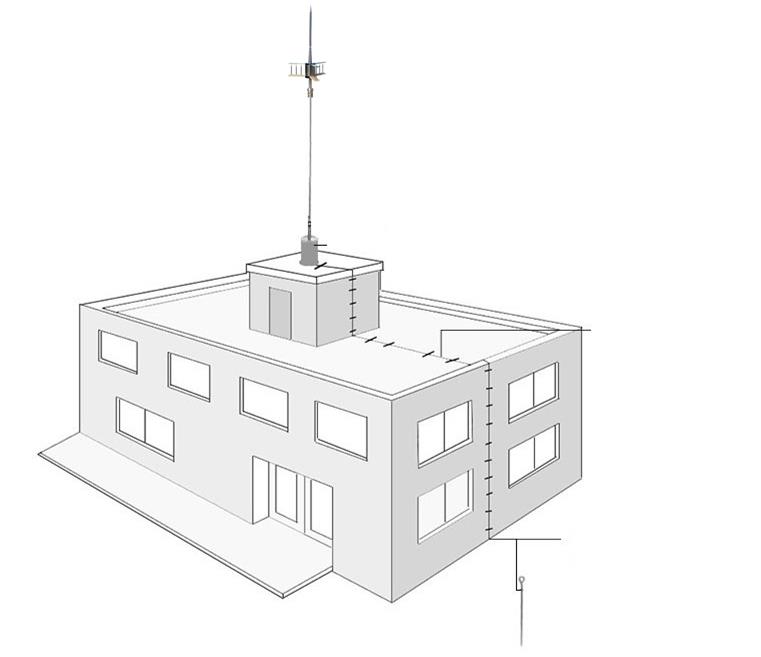
The existing 4.5m experimental antenna in the laboratory is used for observation. After receiving the signal through a unipolar feed horn, it is transmitted to the back-end signal processing area of the laboratory after a series of analog signal processing such as amplification, filtering and mixing. The signal is input to the receiver digital processing platform designed and developed by Casper. At this time, the signal contains a strong signal frequency band for communication, For neutral hydrogen observation, these communication broadband signals are RF interference signals with great strength.
After the received analog signal is amplified and mixed, it must first be input into the ADC board to realize digitization, which is a very important step. The signal quantized by ADC is digitized, and the digitized signal can be processed according to the algorithm requirements, so as to obtain the observation results of hi spectrum. Fig. 1 signal receiving and processing process corresponding to 4.5 m antenna observation in the laboratory.
The realization of spectrum line terminal based on Caspe hardware platform is based on the idea of software radio. The central idea is to construct an open, standardized and modular general hardware platform, and realize various functions (such as polyphase filtering, frequency band acquisition, modulation and demodulation type, data format, communication protocol, etc.) through software. Liberated from hardware based, purpose oriented implementation methods. The software of function needs to reduce the hardware circuit with single function and poor flexibility, especially the analog link, and make the digitization process as close to the antenna as possible. Adopt an open and programmable structure to change the hardware configuration structure [3].
3 Analysis of influence of ADC quantization on observation sensitivity [4-8]
ADC board is a very important link in the whole process. It is a link connecting analog and digital. Figure 2 describes the structure diagram of ADC. The pre filter can remove the spectrum higher than a certain frequency in the input signal to avoid high-frequency signal aliasing into the working frequency band of ADC. Then there is the sample and hold circuit, which can sample the input analog signal and keep it unchanged at a time point. Its purpose is to enable the later stage circuit to convert this fixed level into the required digital coding. This time is also called the conversion time.
The conversion process is also the quantization process. At this stage, the reference level is divided into multiple small intervals (for example, there are 2n cells in an n-bit ADC). When the quantization interval corresponding to the input sampling level is found in the conversion time, the digital processor can map it to the corresponding digital output value, encode and output it, and obtain the final digital output signal.
Circuit characteristics determine some key indicators of ADC, such as sampling and holding circuit, which determines the accuracy and linearity of ADC; The quantizer determines the resolution of ADC; The output buffer determines the output rate, etc. The accuracy (resolution) of the digital to analog converter is defined as the bit width of the digital signal used to describe an analog signal value in the analog-to-digital converter. The n-bit ADC uses 2n different values to represent the continuous analog signal value in the full range, usually represented by LSB (least significant bit).
The impact of n-bit quantization is derived below. Set VF as the full-scale voltage value of the input analog signal and P as the quantization level. If the number of bits of ADC is n bit, it is related to:
ADC uses discrete digital quantity to represent continuous analog quantity, so a noise caused by quantization will be introduced in this process. In the process of representing analog quantity with discrete digital signal, because there is a similar rounding process in the quantization process, the maximum quantization error of the introduced quantization noise can reach P / 2. If the input signal is determined and assuming that the input signal is evenly distributed in the range of full scale, that is, evenly distributed between (- VF / 2, VF / 2), the quantization noise will be evenly distributed between (- P / 2, P / 2). Here, if the quantization noise signal is set as X, there are:
Variance is a statistical feature of the fluctuation degree of random signal up and down the mean value. It is an operation used to explain the deviation degree of each possible value of random signal relative to the mean value. If x (T) is defined as a stationary random signal, there are:
D[X(t)]=E[X2(t)]-E2[X(t)](7)
Set the signal x (T) as the noise current added to the unit resistance, then E [X2 (T)] represents the instantaneous power consumed on the unit resistance, including an average of AC and DC power. E2 [x (T)] can be regarded as the equivalent DC power consumed on the unit resistance. Thus, it can be seen from equation (7) that D [x (T)] represents the average value of the AC part of the instantaneous power consumed on the unit resistance.
Sensitivity is a very important index for a radio telescope. It usually refers to the minimum flow that can be observed by the telescope? T stands for. In the following derivation and calculation, tsys is the system noise temperature, t is the observed integration time, BW is the observed bandwidth, then:
When the observation radio source does not enter the observation range of the telescope, the input power of the telescope within the observation bandwidth BW is as follows:
Poff=KTsysBW(9)
The corresponding power fluctuation is:
When the observation radio source enters the observation range, if the increase of received power caused by the radio source is higher than the power fluctuation poff before the observed source enters the observation range, the detection of this source is a reliable detection. Ptotal represents the total power of receiving and processing, and psource represents the receiving and processing power brought by the target observation source. At this time, there are:
When a in equation (14) is large enough (greater than 3), the observed radio source is considered to be a source that can be reliably observed.
For the voltage signal processed by ADC, the more bits of ADC device, the more accurate the voltage value. The noise influence caused by quantization error has been calculated above, and the quantization noise introduction power PN can be obtained:
Where n is the number of ADC quantization bits. It can be seen that f (n) = 2 × F (n + 1), when there are enough quantization bits, it can be known that PN is very small, so ptotal is hardly affected. In other words, in this case, when the number of ADC quantization bits is enough, the impact of quantization on the observation is very small and can be almost ignored. However, in the process of spectral line observation, if there is a strong RFI (radio frequency interference) in the observation frequency band, the situation will change greatly. In this case, tsys can be regarded as a function of frequency. At this time, the influence of PN introduced due to ADC quantization error has changed greatly. Ptotal has been greatly improved due to the existence of strong RFI. P2 represents the power with RFI and P1 represents the power without RFI, then:
P1,total=P1,off+P1,source+P1,n(17)
P2,total=PRFI+P2,off+P2,source+P2,n(18)
When the whole spectral line observation is compressed into the quantization voltage range of ADC, the changes of each quantity are as follows:
P2,total》P1,total; P2,off
Comparing the observation with and without RFI, there are:
In other words, ADC quantization noise has a greater impact on the observation. When the radio source signal is very weak, this change may cause the signal to be submerged in the noise. According to equation (13), increasing the integration time can improve the sensitivity of the system and obtain better observation effect, and the impact of ADC quantization is part of ptotal in equation (13). Therefore, if the observation is carried out with RFI, the increase of the impact of ADC quantization can be optimized by increasing the integration time.
4 proof of observation and analysis
During the period when the neutral hydrogen signal is relatively strong, the 4.5m antenna is used for observation. The ADC is 8 bits and the effective data part occupies 4 bits. The data is subjected to 32K point FFT. After 100000 times of accumulation, the spectral line diagram shown by the dotted line in Fig. 3 is obtained. The data is quantized by 1 bit to obtain new data. The spectral line diagram obtained by the same processing is shown by the solid line in Fig. 3, It can be seen from the comparison that the reduction of data quantization bits leads to the obvious reduction of signal-to-noise ratio. Fig. 4 shows the ratio of the spectral line data corresponding to 1-bit quantization to the spectral line data corresponding to 4-bit quantization. It can be seen that the ratio decreases significantly stronger than other frequency bands in the corresponding neutral hydrogen signal frequency band, indicating that the influence of quantization noise with lower quantization bits is more obvious.
The 4-bit quantized data is subjected to 32K point FFT. After 1000 times of superposition, the spectral lines are obtained, as shown in Fig. 5, and the spectral lines obtained by 100000 times of superposition are shown in Fig. 6. The actual data processing results confirm that increasing the integration time improves the signal-to-noise ratio, so as to compensate the influence of low quantization bits on the observation.
5 Conclusion
When debugging in the laboratory, if the narrowband strong interference signal is not properly attenuated, the ADC will be saturated and the output will be truncated, resulting in serious distortion and deformation of the spectrum output waveform. At this time, the attenuation of the input observation signal must be increased to ensure the unsaturated ADC of the strong interference signal, so as to observe the normal spectral line. However, after the attenuation of the input observation signal is increased to make the strong interference signal unsaturated ADC, the noise of the ADC device itself is highlighted in the hi observation frequency band, and the hi signal to be observed is mixed in the noise. Statistically speaking, it can be compensated by adding enough sampling points, which can also be understood as increasing the integration time to increase the sensitivity of the system, so that effective observation results can still be obtained.
reference
[1] EWEN H I, PURCELL E M. Observation of a line in the galactic radio spectrum: radiation from galactic hydrogen at 1,420 Mc./sec[J]。 Nature, 1951,168:356.
[2] Qian Lei. Preface to the study of neutral hydrogen [J]. Progress in astronomy, 2011, 29 (4): 408-421
[3] Yang Xiaoniu, Lou Caiyi, Xu Jianliang. Principle and application of software radio [M]. Beijing: Electronic Industry Press, 2001
[4] FELLI M, SPENCER R E. Very long baseline interferometry[M]。 Netherlands: Kluwer Academic Publishers,1989.
[5] Zhou Tao. Influence of quantization accuracy on the performance of digital receiver [J]. Electronic information countermeasure technology, 2006, 21 (6): 20-23
[6] Lidi. High tech sigma delta_ Design and research of ADC [D]. Xi'an: Xi'an University of Electronic Science and technology, 2010
[7] Shi Jun, Zhang naitong, Wang Huiyu. Research on quantization order of UWB digital receiver [J]. Radio engineering, 2008, 38 (2): 20-22
[8] Jiang Biyu. Radio astronomy tool [M]. Beijing: Beijing Normal University Press, 2008
Editor: JQ, read the full text“
Our other product: